Today I am presenting at the TFM conference to discuss how the use of data can transform your customer journey. TFM is a leading event for marketers to get together and discuss all things innovative.
I will be demonstrating how to use your data to improve campaign performance and customer experience within a 20-minute presentation. Below I’ve transformed my speech into a blog for those unable to attend.
Here’s what you need to know to comprehend the value in understanding your audience.
The product life cycle
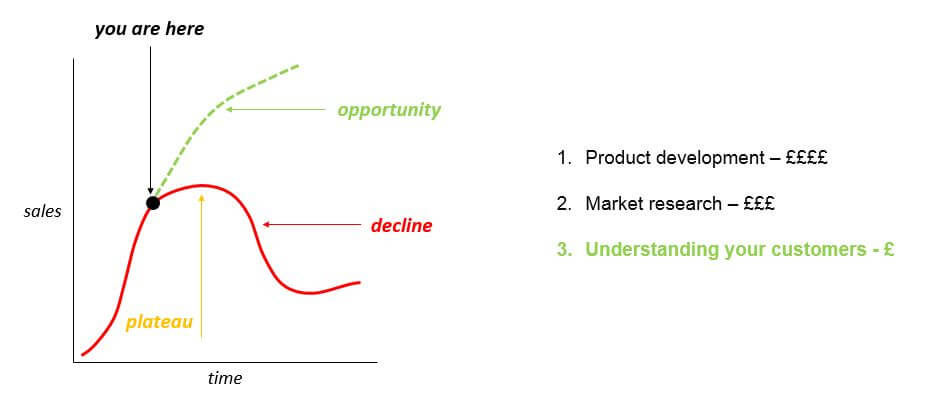
Imagine a product lifecycle graph, with revenue plotted over a range of time. Think for a moment… Where is your business on this graph? Is it in the rapid growth stage when you are smashing your targets however ambitious they are?
Or is it at the point when your market is more saturated and your business growth is going to slow down soon and reach a performance plateau, with a highly-probable decline after? Now consider this very important question… What would you do to change the shape of this graph?
First, you can consider introducing a new product, which comes with large investments in new product R&D, production, marketing and product launch risks.
Second, you can consider doing a market research to find out what your customers need from a product like yours. It also comes with a long wait for results and investments in the reliable market research.
OR
You can use your own data to define who your customers really are and how their behaviour is changing.
It can’t be stressed enough how smart use of your own data can save you money and create those opportunity insights you are looking for to change the shape of your business performance graph.
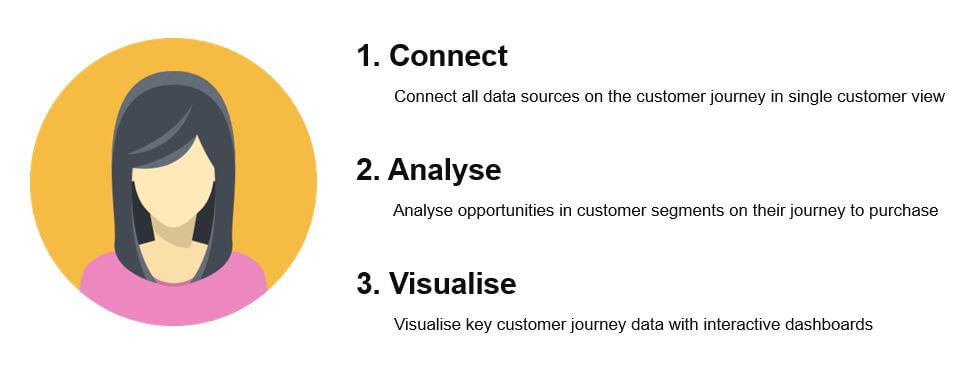 We are going to look at three key stages of creating customer insights from your own data:
- First stage: Connecting the data from different data sources on a customer journey into a single customer view.
- Second stage: Analysing what knowledge about customer behaviour is going to make a difference to your business.
- And finally: Visualising single customer view on dashboards to ensure the insights are equally available to all your team members.
Collecting and Connecting the Data
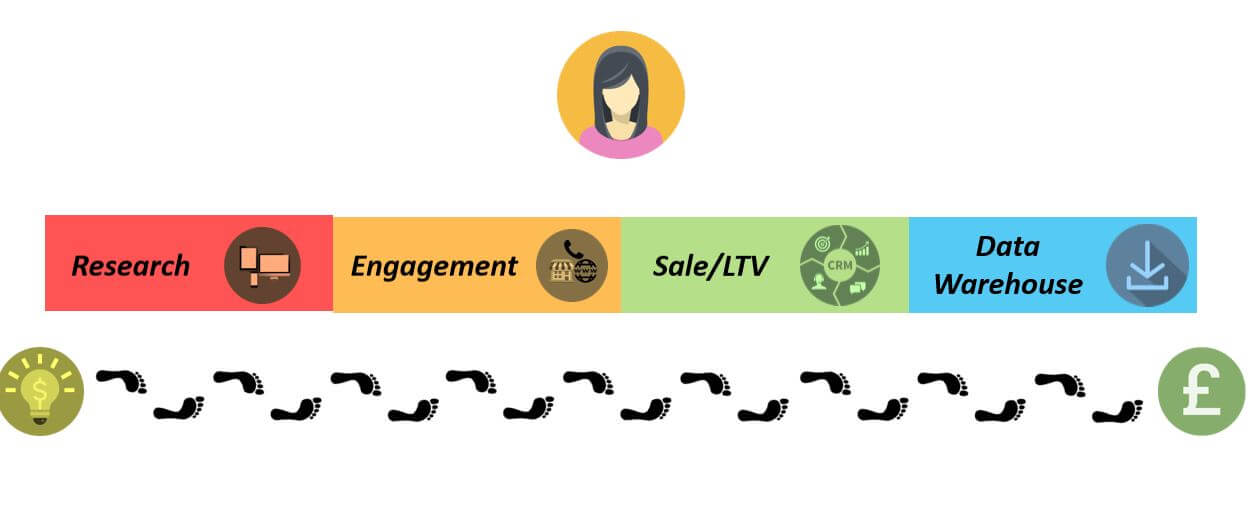
Initially, the data collection process is quite straightforward. Customers do their research, they engage with you and their conversion record goes into your CRM. Finally all historical data is stored in your data warehouse.
However, there are a couple of complications in this process.
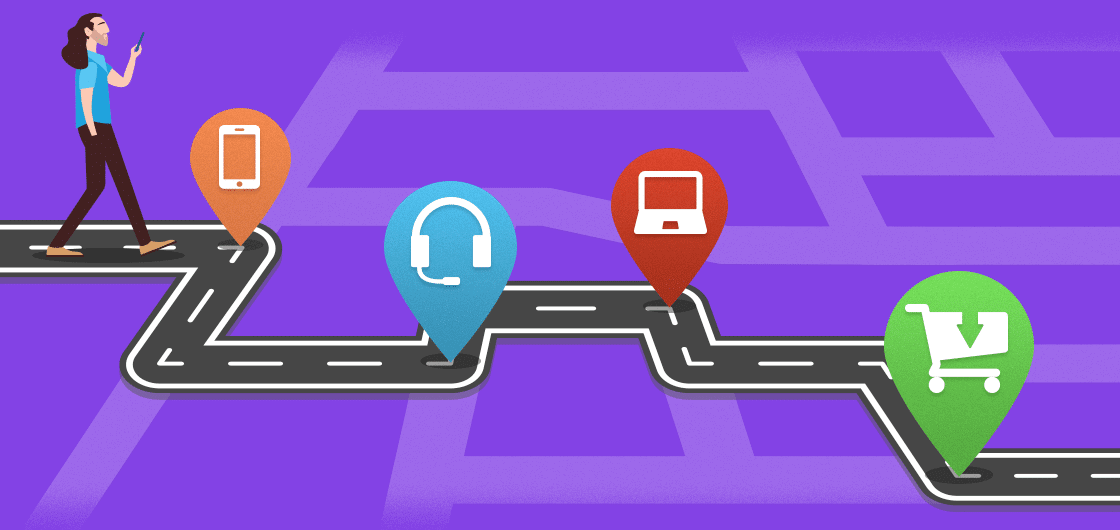
1) Customers do their research on multiple devices, not just one
2) They engage with you through multiple channels, not one.
It is therefore vital to consider… What can you do to overcome these complications and connect customer journey?
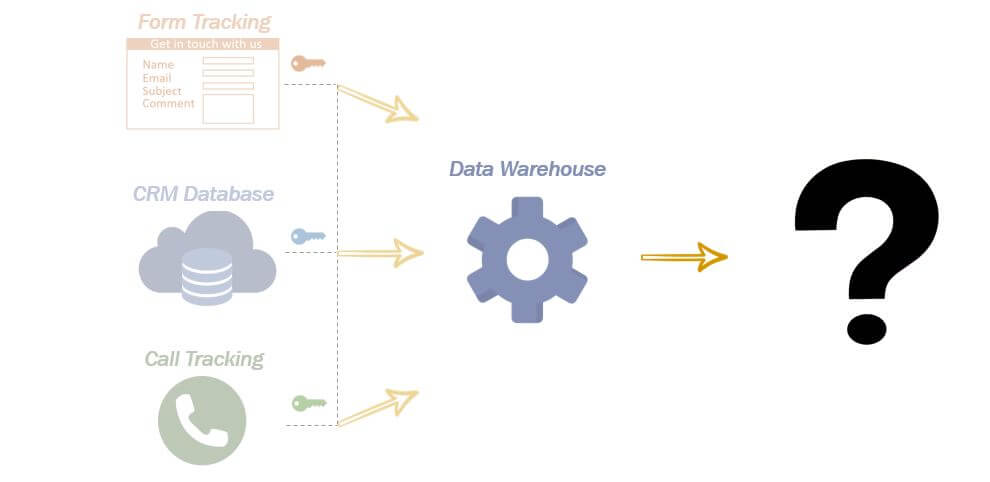
We need to use that customer footprint left on each part of their journey to connect several data sources in one.
We use customer footprint from cookies on website, customer ID from CRM, and we can overlap them during the engagement to connect all pieces of customer footprint together.
It is crucial that we connect customer footprint from multiple platforms into a single journey.
Why data connection is so important?
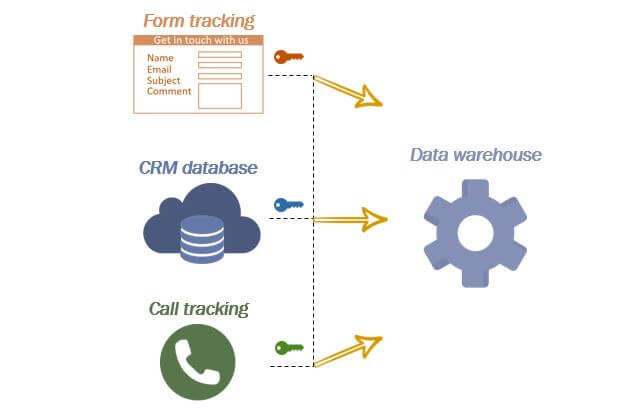
If you are a lead generations business or in retail, this is a way for you to connect your revenue back to online budgets and measure ROI. Especially if you sell B2B, educational courses or travel holidays – this is a data connection model for you.
You start from connecting your customer ID in CRM with visitor ID in online lead forms and caller ID from dynamic call tracking. That’s your connected customer footprint that you associate with every customer in your data warehouse.
As a result of this work, this travel company could increase the quality of their leads without increasing budget, and drive 60% increase in lead volume year-on-year.
This stage is key for you if you want to measure ROI and optimise your campaigns towards revenue, not just leads.
Analyse Who Your Customers Are
Lets step back from data. What’s important for your business? Do you want to acquire new customers, upsell to existing ones or sell them more often?
All of the above require an answer to the question who your customers really are. The answer is there.
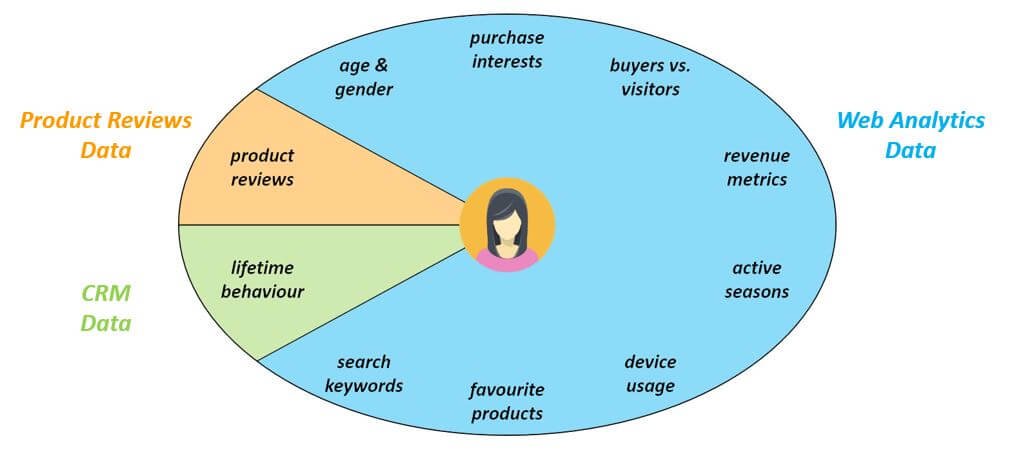
By segmenting customer behaviour in different aspects, from social-demographic context to what they like to buy, how they prefer to do it and what is their aftersales behaviour, we create rich data-driven personas, all based on your data.
Effectively, knowing and measuring who your customers are will assist you in developing products, personalising your owned media and measuring the success of your marketing campaigns.
For one of our ecommerce clients, we analysed their web analytics and product reviews data to create their data-driven customer personas, and define their priority for the company on a simple model.
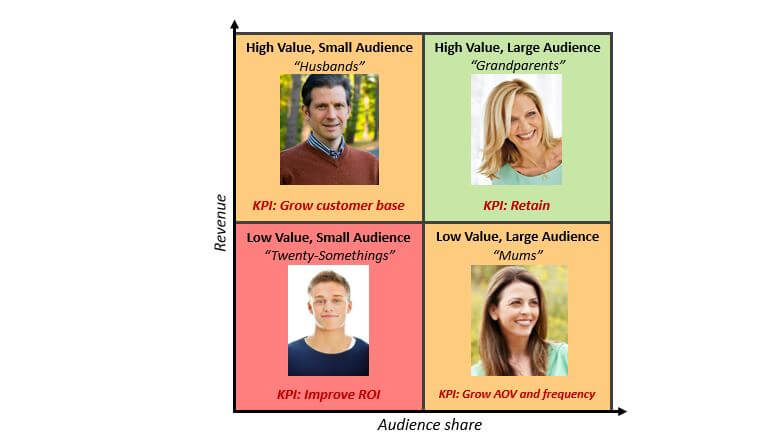
As you can see, in this case, group B is the most important segment that the company need to retain and keep happy. This is based on the revenue they bring and the percentage of them in their audience.
Group A’s segment has an opportunity for new customers acquisition since they have high value from the first purchase and this company does not have many of them yet.
Group D’s segment is a target audience for remarketing and reactivation campaigns to increase their lifetime value for the company.
As a result of this work, the retail company have personalised their paid media campaigns towards each of these customer segments. They have completely rebuilt their reporting dashboards to reflect the change in customer behaviour. Finally, they have also fed the results of the analysis to product development and website optimisation teams. In order to make customer experience with their company much more personal.
Such analysis is a critical step to increase the effectiveness of your customer-centric campaigns, leading to product and marketing personalisation.
Visualising Data Using a Simple Dashboard
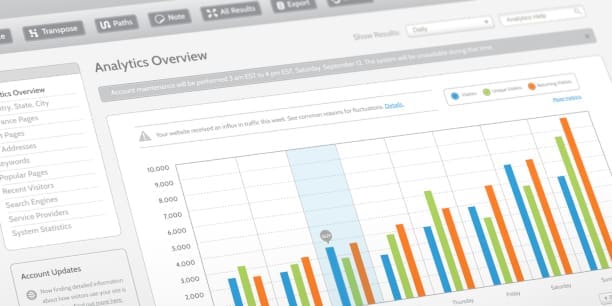
Finally, stage three – visualising the insights from your data. How to make the data available and accessible for ongoing insights to every member in your marketing team?
It is not enough to create a single customer view, the data is usually too complex to access for non-analysts. But what if you could build a simple and visual dashboard that everybody in the team can access?
This is important point to stop for a moment and think.
Imagine that you are in the boardroom with key stakeholders. They ask you about your decisions that would change the effectiveness of your digital marketing. What data would you need in front of you?
Imagine you can see your perfect data dashboard in front of you. This is what somebody asked us for. They wanted to increase their efficiency in selling premium travel holidays.
We gave them this dashboard to measure ROI for online and offline channels, evaluate their product performance and investigate lead quality.
Visualising full customer journey was a key stepping stone for them to transform their business KPIs and performance.
To Summarise
Let’s get back to our initial question: how to create a data-driven picture of your customers’ behaviour and the way to measure the change onwards.
- Firstly, connecting the data on customer journey is key for you if you want to measure ROI and optimise your campaigns towards revenue, not just leads.
- Secondly, analysing customer insights from your own data is a critical step to increase the effectiveness of your customer-centric campaigns leading to product and marketing personalisation.
- Thirdly, visualising full customer journey on a simple dashboard is crucial to make customer insights accessible across the business and helps transform your business KPIs to drive performance optimisation.
As a one-line takeaway, this is your formula.

Want to know more about our Analytics and Marketing Science services ?
Get in touch with us to learn how to help your business understand how they can use data efficiently to understand their customers better.