In the bygone era of horse and carriage, a ‘dashboard’ was the protective structure installed to deflect mud, rocks, and other debris that were dashed up by the hooves of the horses. It served to provide the riders with a clear, unobstructed view of their path. Today, in the digital era, the concept of a dashboard has been adopted by the business world. Much like its original purpose, a business dashboard aims to filter through the endless barrage of information and present only the most critical performance metrics. Now, as we navigate through the age of AI, where bots grapple with unstructured analytical tasks, the design of dashboards must evolve, offering these vital indicators with unparalleled simplicity and clarity.
Amid the artificial intelligence revolution, we see bots efficiently addressing complex analyses, allowing our modern dashboards to prioritize on simplicity and clarity. They highlight carefully selected key performance indicators (KPIs), optimize designs for visual pattern recognition, and present clean, uncluttered screens. Interactivity is maintained to facilitate understanding, not to distract the user.
Each audience and objective necessitates a unique approach that calls for ruthless simplification. For instance, marketers may focus on tracking engagement, sales teams on monitoring deal progress, and finance departments on visualizing financial vitals.
The selection of KPIs requires cross-functional input within a business, helping to distil vast data catalogues into essential elements that align with strategic goals. It’s equally important to decide which metrics to leave out, in order to prevent information overload. Metrics not immediately necessary can be left for AI bots to analyze on demand.
Dashboards, with their deliberate designs, can direct focus where it’s most needed. This includes thoughtful layouts, judicious use of color, size, and whitespace. Although drill-down capabilities are necessary, they should be designed to provide insights rather than distractions.
Our dashboard design employs a comprehensive 7-step process:
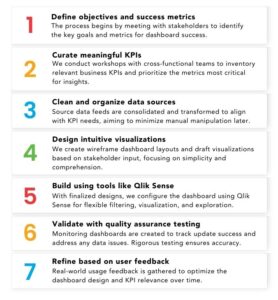
This meticulous process results in focused dashboards that enable leaders to cut through the noise and make informed business decisions. In the age of AI, the design of effective dashboards requires a keen focus on simplicity. By carefully curating KPIs, utilizing clean visual designs, and incorporating deliberate interactivity, attention is directed to what truly matters. Amidst the vast sea of data, today’s dashboards surface the crucial few signals, allowing leaders to monitor performance and take decisive action when needed.
GET IN TOUCH