DAC manages over 1.5 million individual location listings for clients in hundreds of countries around the globe. This size and scale gives us a unique perspective to help highlight important insights applicable to brands that rely on driving revenue via local search. We are asked constantly to provide context when we review reporting with clients. For example, if KPI’s are up 70% YoY, is that good, or is it bad? Context is everything when it comes to reporting and with that in mind, we set out to provide context around local search metrics coming out of the extremely difficult past 2 years. In other words, we wanted to dive into our data and see if we could produce benchmarks.
Why industry benchmarks are important
Industry benchmarks are highly valuable but notoriously difficult data points to collect. To evaluate how your business is performing in the marketplace, you need to not only assess your metrics year-over-year but compare them against competitors in your industry. The previous two-and-a-half years demonstrated perfectly how a business can make no mistakes yet still incur losses due to industry-specific or worldwide trends.
To help you understand if your business is keeping pace in this new normal, we’ve pulled from our robust client data to set the industry benchmarks you need—just as we did in our previous blog post on reputation management benchmarks. This time, however, we’re revealing all about industry trends across Google Business Profile (GBP, formerly Google My Business).
How we sliced and diced our data
We’re again comparing April 1 2020 to March 31 2021 against April 1 2021 to March 31 2022, which covers the disruption of initial COVID lockdowns up to the relative normality of today. Regardless of how businesses may have struggled in early stages of the pandemic, the unknowable impact of that storm should now be over. Indeed, most businesses should be experiencing some form of upswing; what matters now is how that recovery compares to others.
Bear in mind that we’re again primarily considering businesses in the US, Canada, and Europe, and that our data sets are constrained by the number of clients we have within those industries. Even so, the scale of the data generated by our client base still acts as a microcosm of businesses within those regions.
High-level considerations
To start, let’s first establish GBP benchmarks for general business performance before diving into each industry in more detail.
Total GBP actions percentage change YoY: 24%
Clicks: 18%
Calls: 14%
Directions: 42%
Total GBP views percent change YoY: 47%
Search: 28%
Maps: 55% (Discovery 42%, Direct 63%, Branded 40%)
With local restrictions lifting and other customer touch points reopening, it should be no surprise that businesses have seen significant increases in their overall GBP KPIs in 2022—as evidenced by the 42% increase in requests for directions. While calls and clicks could have fluctuated depending on each business’s ability to retain clients during lockdowns, in-person store visits could only have increased so dramatically with the easing of restrictions. That’s especially important for dine-in restaurants, gyms, and retailers, for whom foot traffic is immensely important.

The same factors also explain the near double increase in map views compared to search. Consumers were no longer looking for ecommerce options but researching where they could make same-day purchases at a physical location. Note how direct searches for map locations grew by 63%, which is significantly higher than incidental discovery and branded searches. The implication is that consumers will always seek out direct access to products and services when available.
The tale of the tape
The following table reveals the industry benchmarks that businesses should measure themselves against. The biggest winners are highlighted in green while the biggest losers see themselves marked in red. If you don’t see your industry represented or simply desire a more detailed breakdown than we have laid out here, get in touch and we’ll be happy to oblige.
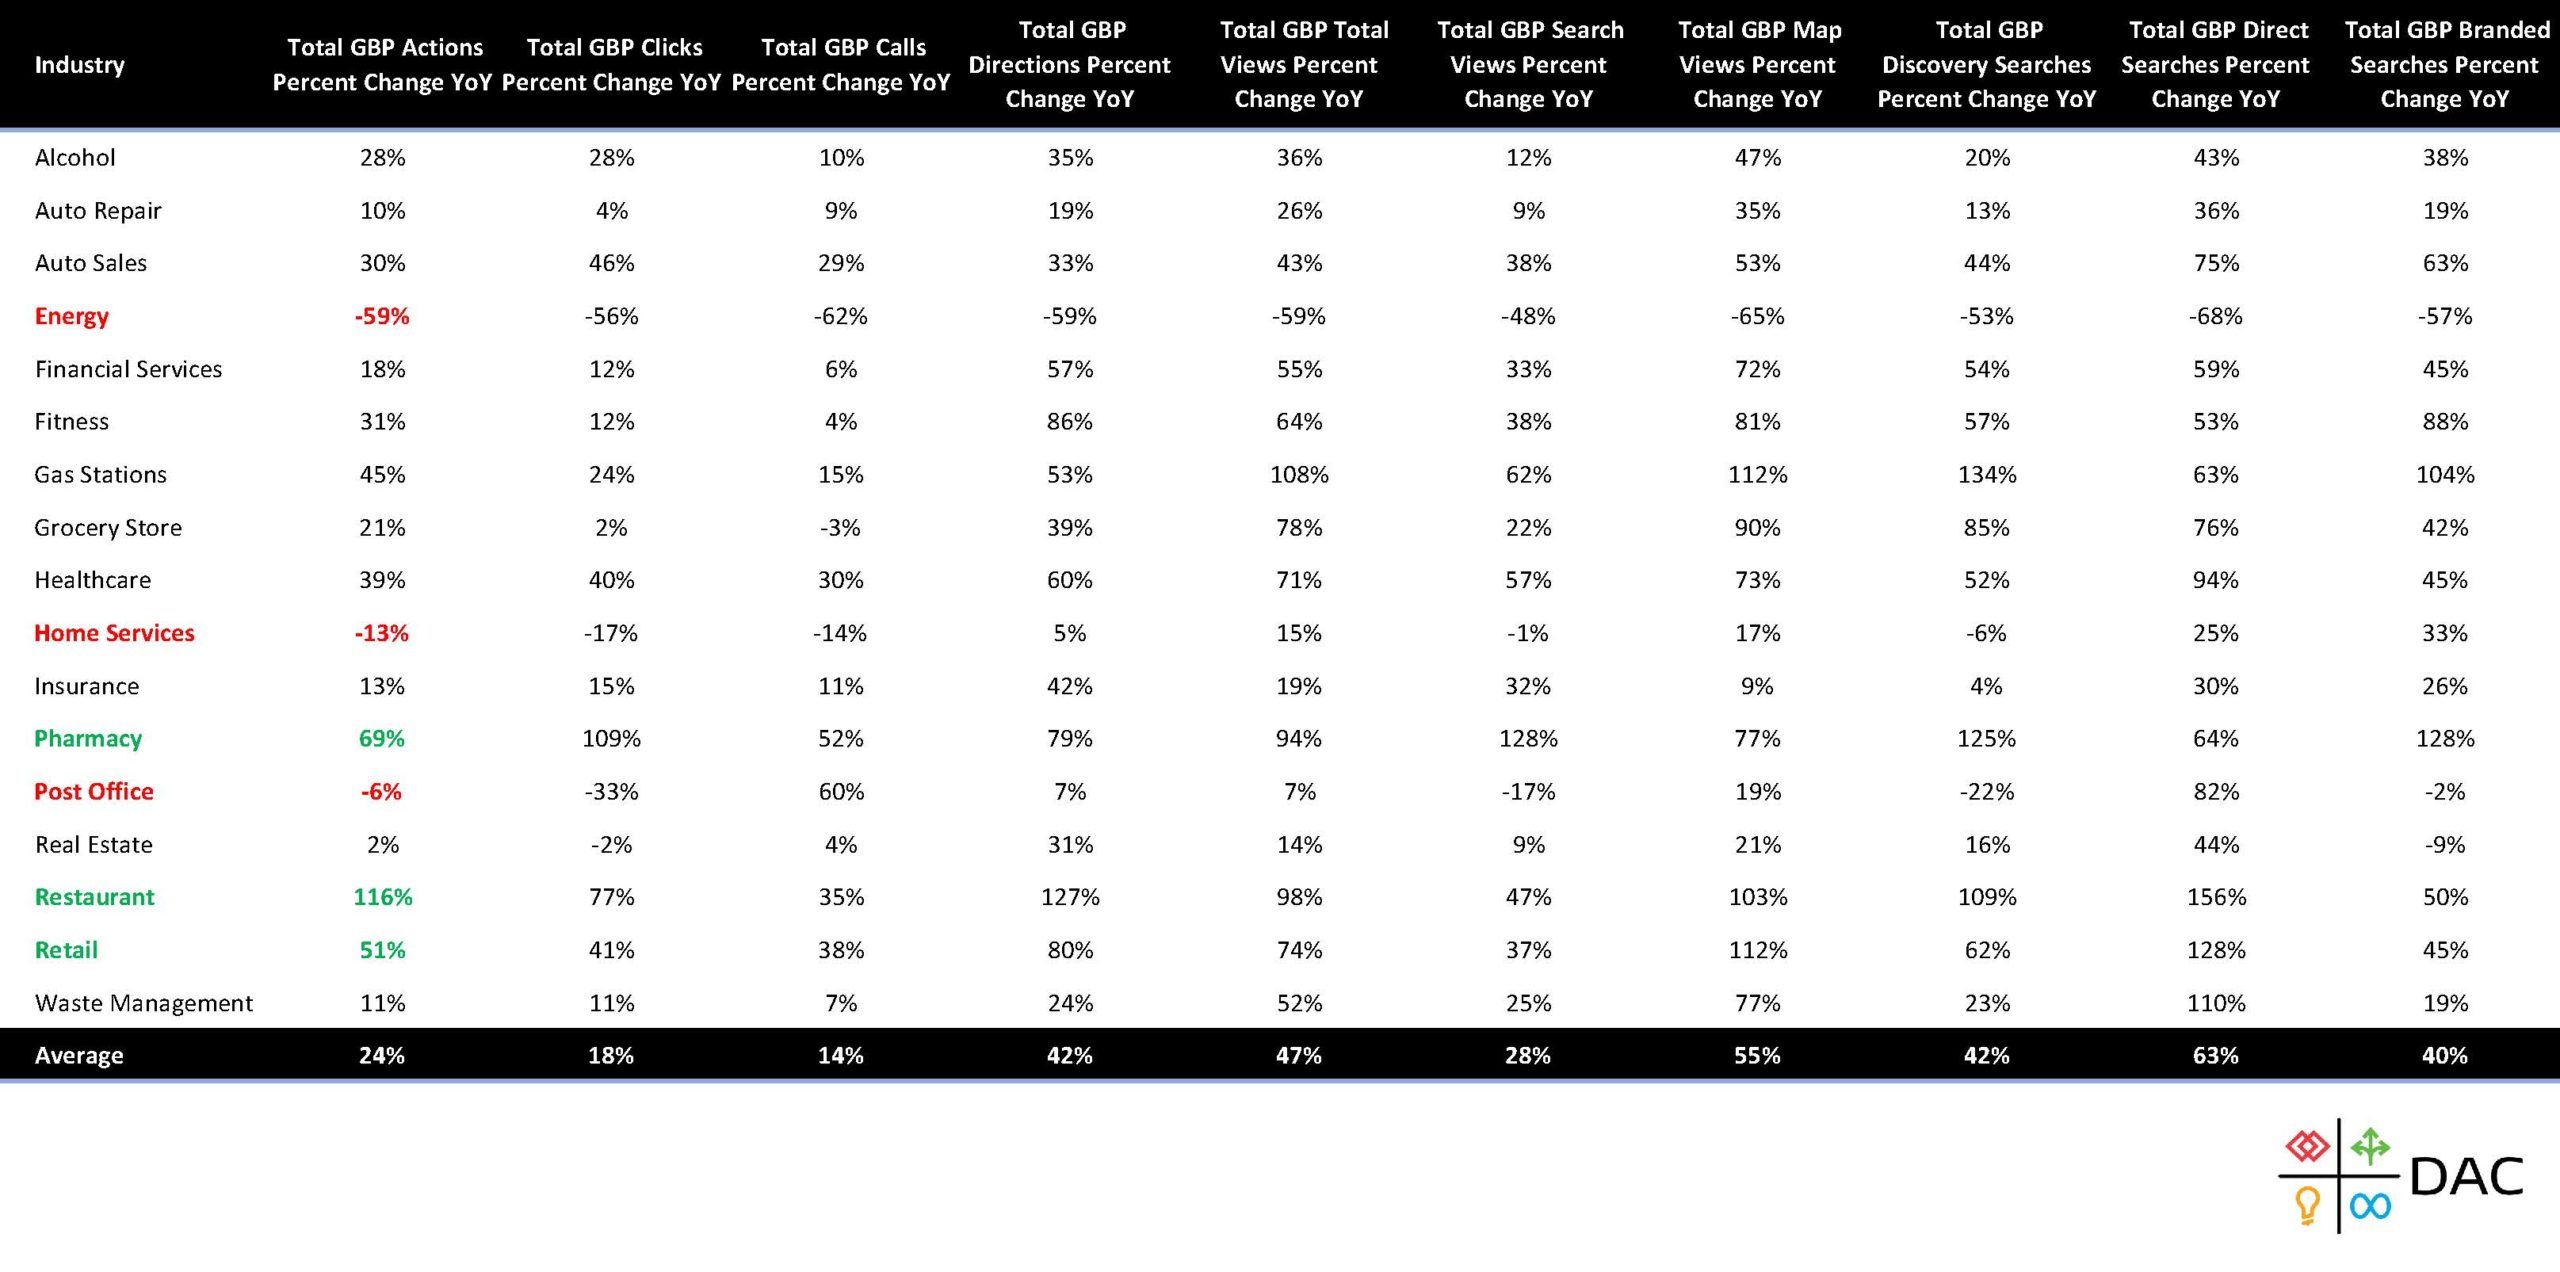
Click image to enlarge or view PDF here
Perhaps unsurprisingly, restaurants, retailers, and pharmacies (a more specific type of retail) saw massive increases in their online and physical traffic—specifically in requests for directions—following the widespread lifting of restrictions. Although the fitness industry recorded an 86% increase in requests for directions (second only to restaurants), it’s not all good news: Gyms and health clubs now face new threats after consumers turned to exercise alternative in the last two years, including convenient at-home workouts like Peloton, which may dovetail nicely with flexible, post-pandemic working models.
The biggest drops come from the only three industries that saw losses in 2022 compared to 2021. The industry which faltered more than any other, however, cannot attribute its challenges to the pandemic alone. With a massive increase in fuel and gas prices, energy providers are struggling to articulate any positive differentiators for consumers. Gas stations, meanwhile, have seen a disproportionate increase in search volume compared to their direct traffic. This is due to consumers searching for news stories about gas prices rather than actually increasing their demand.
Some industries, despite how others are faring around them, can’t expect large volumes of growth or decline. For those who have seen their GBP metrics remain static year over year, our benchmarks suggest that consistency may just be what you should expect.
So… what does this mean for your business?
Physical locations are back. As much as the pandemic shifted consumer behavior online, a significant proportion of most populations will always prefer and prioritize in-person experiences. If you neglected your listings during the pandemic—for instance, allowing your hours of operation to drift out of sync with reality—this is your final reminder to rectify any lingering Local Presence Management issues.
For those who have remained on top of their online listings, now is the time to compare how your business is faring against the rest of your industry. Using the benchmarks we’ve provided above (or by reaching out to us for a full data set), you can see if your year-over-year performance is meeting your industry’s standard. If your performance is stagnating and your industry is struggling, are you doing everything you can to mitigate losses? If you’re growing in a thriving industry, are you doing so at the same rate as your competitors? Viewing your own performance in isolation will never give you the full picture.
For those lucky few industries that have escaped the pandemic relatively unscathed, there are still noteworthy trends to help you understand where to allocate resources. Post offices, for example, have received fewer website views via GBP in the past year, but call volume via GBP has risen 60% in the same time period. Local managers should therefore expect more customers to contact them by phone rather than online, using industry benchmarks to not only assess general health but inform real-world business practices.
Want to get more from your GBP listings? It just happens to be our area of expertise. Let’s talk!
GET IN TOUCH