In times of extraordinary change, how should businesses navigate and interpret the massive quantities of data coming their way? Here at DAC, our strategic planners, analysts, and insights specialists spend all day every day interpreting numbers. But what happens when those numbers suddenly seem to become irrelevant in times of massive upheaval or change?
Right now, we’re facing unprecedented times—in the midst of this COVID-19 crisis, it seems like things are changing so quickly that one day’s numbers are no longer relevant by the next. We’re accustomed to looking at 30 or 60 or 90 days of historical data to make forecasts, but that feels impossible now.
Many businesses who rely on big data for decision-making are struggling with this right now. So, we’d like to propose a few guiding principles to help data-driven decision makers cope with a crisis of this scale.
In the short term, the numbers will lie
South African poet Steve Hall caught the attention of the world last week when he started a poem about COVID-19 with the line “What a year this week has been!“
The pace of change in these past days and weeks has been astounding. News briefings in the morning are obsolete by the evening. Businesses are adjusting every day to new closures, restrictions, regulations. Behaviors and assumptions that seemed safe a few short days ago are now unthinkable.

For example, a report issued by eMarketer on March 12—just a couple of weeks ago, but seemingly in another lifetime—predicted that global ad spending would increase by 7% in 2020 versus 2019. However, even eMarketer prefaced its report stating that this assumption was based only on declines seen in China and East Asian markets, and that it did not take into account recent COVID-19 related closures and spikes in Europe, North America, or the rest of the world, nor did it factor in major cancellations or postponements such as the 2020 Tokyo Olympics.
Since the release of this report, eMarketer has chosen to stop making adjustments to its forecasts until things start to stabilize enough to allow for more confidence in predictions. Most other data providers are doing the same.
This means that many of the numbers we usually are able to trust will lie to us in the short term. Looking at the past 30 days of data to predict the next 30 days won’t help in a crisis. Looking at last year’s sales numbers won’t give us an accurate depiction of the same period for this year. Things are changing too quickly.
In the long term, the numbers will adjust
We’re all having conversations about the “new normal” and what it might look like once we’re on the other side of this crisis.
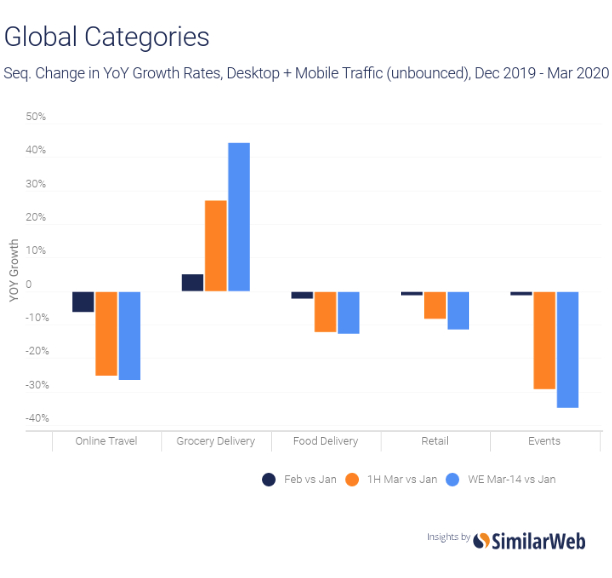
We can look to countries that have been battling this the longest, such as China or South Korea, to get a preview of what to expect, and confidently make certain predictions based on the trends in traffic that we’ve been seeing over several months worldwide. As consumers adjust their behavior to the new realities, we’re seeing spikes in demand for services such as grocery delivery, while travel, retail, and events are taking the hardest hits.
Over time, we will see these trends start to emerge in the data. And they will allow us to make mid- and longer-term predictions about what various segments of the market will need, want, and expect from businesses moving forward.
The outputs are only as good as the inputs
Suddenly, the world is getting a crash course in all these concepts that we insight strategists work with every day: statistical significance, confidence intervals, data collection methodologies, random sampling, trendlines. In order to understand what—if anything—the numbers are telling us, we first need to understand where they came from, how they were gathered, and what their limitations are.
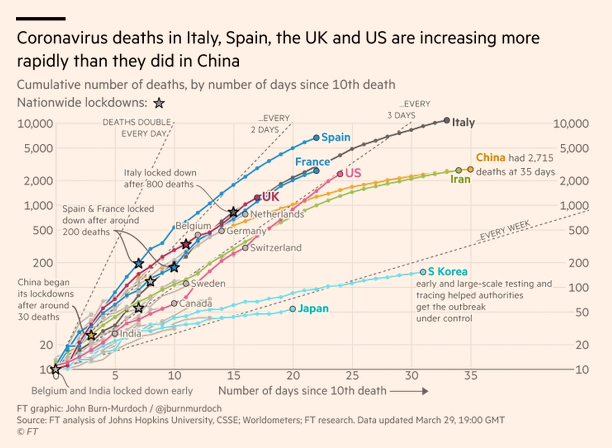
For instance, just take the numbers of worldwide cases of COVID-19 being reported by countries and official organizations. Are we flattening the curve? It’s hard to say because there are too many inconsistencies and unknowns. Differences in testing criteria and numbers, delays in data, variances in methodology, and the fact that people take time to recover (or, tragically, to not recover), all mean that the “official” numbers we’re seeing may only be telling a small part of the story—and not a reliable or representative part, at that.
For anyone—individual or company—trying to interpret this massive quantity of data, here are a few tips from our team of analyst pros:
- Ask where it comes from and how it was gathered.
- State all assumptions, and question their basis.
- Focus on the specific thing you’re trying to answer.
- Look for directional, not absolute.
We can’t afford to stop planning ahead
The one thing we know about any crisis is that it will eventually end. We don’t know exactly when, but businesses that are pausing operations today will need to scale back up quickly. For businesses forced to temporarily close or pause, the time to do some of that long-term planning is now.
A crisis is also a game-changer; it is fundamentally changing how we do business. Here again, the data and the trends can help us as we look ahead to how changes in our society will impact business needs. Even if historical data loses its significance, we can still look to various types of reports including:
- data about market recovery in different sectors in countries that are furthest ahead in the curve (e.g. China);
- audience and demographic data that predict future growth areas;
- social media conversation data—both to manage the crisis in the short term and to look ahead to market demands and emerging ideas and opportunities;
- cyclical historical or economic data to understand the macro effects that major world events have on society and to learn from them.
The data is still useful. We just need to view it through a different lens; a longer, more future-focused one that assumes that the extraordinary changes we’re living through today will lead to new and different ways of doing business tomorrow. Now is the time to start.