There are huge changes in online search as COVID-19 continues to alter the daily habits of people all over the world. Stay-at-home guidelines and non-essential business closures have drastically changed the landscape of both local search and commerce in general. In times like these, there are obvious industry booms and busts. The healthcare industry (unfortunately) gained a massive boost in traffic while cinemas lost all of theirs due to closures.
We’re going to take a look at the hard numbers to truly quantify those broad, anecdotal trends. If, for instance, you run a grocery business and you’re seeing an expected increase in traffic, how do you know you’re capturing your share of this increase compared to your competitors? If your revenue has jumped 30% but your industry is seeing a 60% gain on average, you may only be reaching half of your full potential. By analyzing the real-world numbers of our clients, we know which industries have grown (and shrunk) and by exactly how much.
Revealing insights through a stable data set
We gathered data pertaining to customer interactions through Google My Business (GMB). Our pre-COVID-19 date range is November 7 2019 through March 7 2020, with the remainder of March considered to be during COVID-19. This gives us a comprehensive insight into general search trends as well as exactly how our clients were affected when mass closures of businesses began.
Our data set includes obvious industry choices—such as grocers and restaurants—as well as energy suppliers and banks. With multiple enterprise-level businesses within each of these categories, we have a stable data set which isn’t hampered by outliers and single business case study scenarios.

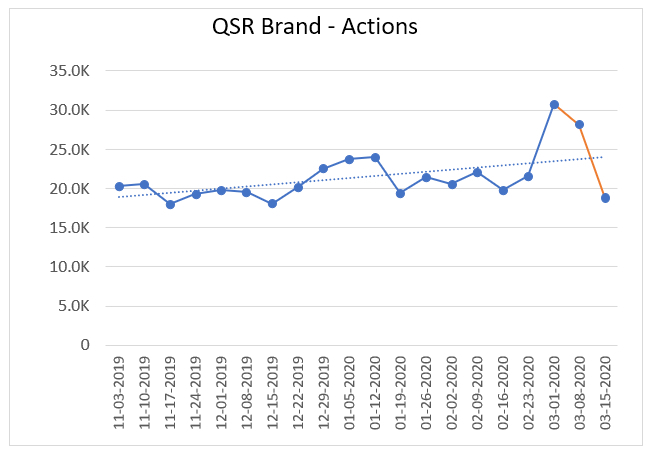
The above chart measures the total change in customer actions through GMB, meaning requests for directions, website visits, and mobile phone calls. While the exact ratio of each may have changed (such as fewer request for directions but more website visits), the total volume indicates if there was an increase or decrease overall.
The biggest winners from the changes in consumer behavior due to COVID-19 are grocery (71%), health (49%), alcoholic beverages (19%), and some businesses within the financial industry (16%). The financial sector was actually much less uniform in its gains: businesses that focus on personal finance and short-term loans cater to clients that have been impacted very differently than the clients of large investment firms. Indeed, the data for the financial sector is less uniform than other industries but generally trended upwards, whereas other sectors generally decreased or plateaued.
Those most negatively affected by the pandemic include clothing retail (-58%), other physical retail (-40%), restaurants (-35%), fitness (-28%), food and beverage (-24%), vehicle services (-23%), and non-gas station energy providers (-12%). Unsurprisingly, many of these businesses rely on foot traffic, so the physical presence of customers will undoubtedly lead to losses during this time.
Although the data shows whether a business has seen a gain or a loss, it’s more important to extrapolate trends to benchmark your own business against. If you are in one of the positively impacted industries, you should work towards capturing the full industry trend; if you are in one of the negatively hit industries, a below-average loss may show that you are successfully mitigating the business effects of the pandemic. So, a 10% increase in traffic is not something to celebrate if your industry is seeing a 20% increase overall—on the other hand, you may be able to feel confident if you’re only suffering a 15% loss in traffic in an industry that’s trending 30% downwards.

Take a close look at the chart above. Some of the numbers are staggering. But they also combine to reveal another impactful industry trend: for the first time in years, standard Google searches for businesses are generating more traffic than searches through Google Maps. It is not an insignificant change either, with the ratio of traditional search to Maps searches flipping from 3:1 to 1:3 in some industries. This is a major change in user behavior—much like the switch from desktop-first to mobile-first—and one that business owners need to recognize in order to act upon.
Contrasting fortunes in the real world

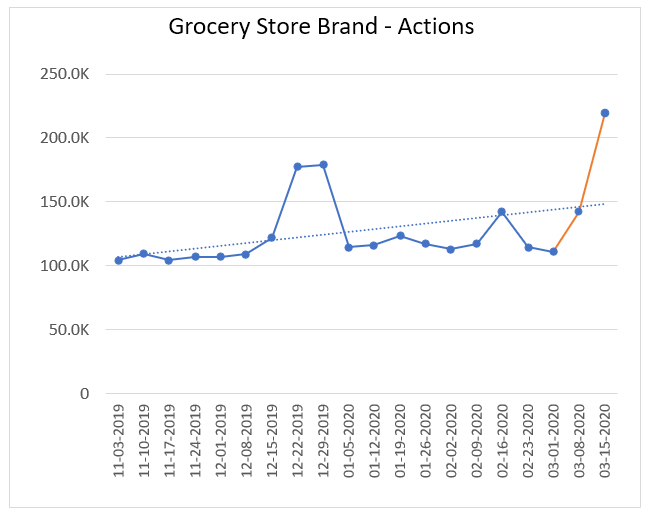
The above major grocery chain saw an 89% increase in search views while seeing a 60% decrease in Maps views—a complete reversal of its ratio of search to Maps. This occurred while this grocery chain matched the industry trend of a 70% increase in overall user actions.
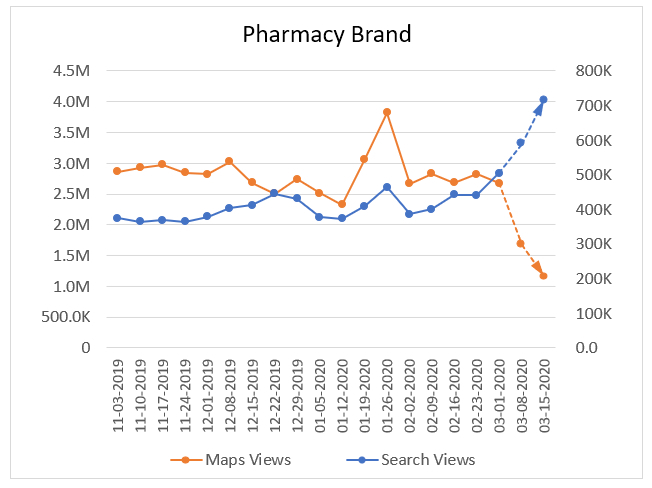

This major pharmacy chain saw the same dramatic shift from Maps searches to traditional search. This occurred while their total user actions nearly doubled, well exceeding the industry trend of a 40% increase.

This restaurant conglomerate saw a downward trend in both search and Maps. Their total actions have an identical downturn to their views on either search method. So, some industries that have been negatively impacted on Maps are being negatively hit within search as well. While Maps shows a steep downwards curve, the slower descent of regular search does not present a significant unexpected change in consumer behavior.
On average, each industry had +11.9% growth in search views, while the map views suffered from a -56.7% drop due to COVID-19.
So… what does this mean for your business?
We have already written about how to prepare for a post-COVID search landscape but there is more to be done in the here and now. While consumers are staying at home, they have reverted to habits reminiscent of a pre-smartphone world. Traditional desktop search is preferred over mobile searches using Google Maps in specific industries. To capitalize on this, businesses should be dusting off their websites to ensure they are 100% optimized.
SEO experts—ours included—have been saying for years that Google My Business optimization is the most effective way to capture new business; that Google My Business is effectively your new homepage. We still are saying this, but we’re also seeing via the above data that consumers are seeking out brand-level, website content because GMB alone is not nuanced enough. Once business has returned to normal, Google My Business optimizations will still be the best method of SEO. In the interim, focus on your web pages.
As COVID-19 continues to change the search landscape, businesses must continue to adapt. Either they will need to weather out the storm or try to capitalize as much as possible on the temporary gains they have access to. With the benchmarks set by this study, you should now better understand if your business is performing to expectations.
It almost goes without saying, but make sure you do everything in your power to keep your business afloat during this trying time. With great change comes great opportunity, so spend the time now to ensure your business bounces back strongly in a post-COVID world.
GET IN TOUCH