Often, research into digital behaviour is segmented by age or generation, and by demographic group, but rarely are trends investigated between cities. A new US-focused study by The Local Search Association, which looks at digital media usage for local business discovery across 12 cities, therefore makes for some very interesting reading.
More than 8,000 consumers were surveyed in cities across the US, with varying population sizes. The focus was to explore how often individuals had used various digital resources to research local business information over a one-week period. The overarching intent of the study was to learn more about whether digital usage varies by city, and to see if the size of the city matters. Another objective was to see how the most digitally-engaged city is searching for local businesses, to gain insight into future emerging trends.
The below map highlights the cities that were considered within the research:

City tier comparisons
For the purpose of the study, cities were tiered according to their population size. Tier one cities represent those with a population of one million or more; tier two are those with between 200,000 and 1m, and tier three have 50,000 to 200,000 residents. The national “digital score” was also identified as being 48, by averaging the overall scores for all cities, in order to provide a baseline comparison.
The city comparisons, by tiers, are illustrated below. As one might expect, search engines appear to be the most popular method of discovering information about local businesses, across all tiers, and indeed all cities. Two tier three cities (Grand Rapids, MI and Harrisburg, PA), have search usage that exceeds the national average of 80% for search engines, so it’s a strong trend that’s consistent across all cities, regardless of size.
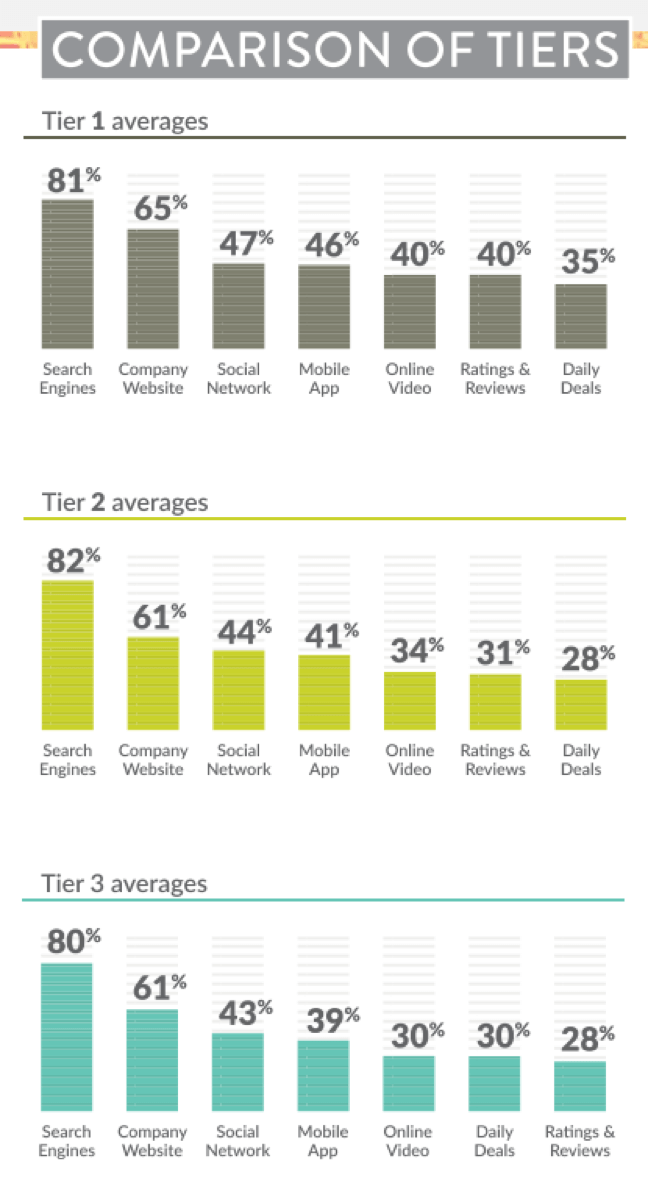
A particularly interesting finding is that company websites remain the second most popular resource for finding out about a local business, above social media. In this day and age, one assumes that consumers are visiting the social profiles of local businesses, such as their Facebook page, Instagram or Twitter profile, before clicking through to their owned website. The finding could be a consequence of company websites ranking more highly than social profiles within search engine results, indicating that local US businesses could be doing more to promote and rank their presence on social networks.
Although on aggregate, social networks rank as the third most popular method of research across all tiers, individual results by city are widely dispersed. For example, within tier one alone, the percentage of people using social networks for their research range from 41% in Phoenix, to 53% in San Diageo, despite both cities having very similar population sizes.
Another interesting comparison is that as city size increases, so does the usage of online video and ratings and reviews, in the discovery of local business information. This could be an indicator of larger cities being more sophisticated in their online research, considering a wider range of sources before making their decision about which local business to visit or make a purchase from.
San Diego (a tier one city) emerges as the most digitally advanced city, which was also the case in last year’s study. However, otherwise, there is little correlation between a city’s size and its overall digital score, showing that digital research trends are happening consistently across both larger and smaller cities in the US.

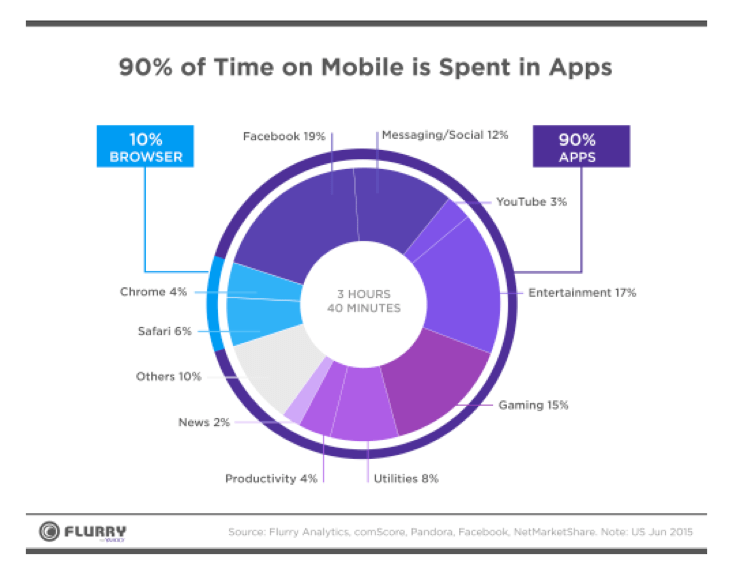
One might have expected mobile apps to rank more highly within findings, bearing in mind that mobile search queries overtook desktop search a couple of years ago in the US. The latest data from Yahoo’s Flurry analytics shows that 90% of consumer’s mobile time is spent in apps. As they put it: It’s an App World. The Web Just Lives in It. This is important for local businesses to consider when they are thinking about whether to develop mobile apps or restrict themselves to mobile optimised sites. But it’s intriguing that the LSA study conflicts with the Yahoo study, in this respect. However, according to LSA, mobile apps saw the largest increase in usage overall, since last year’s study.
It would be extremely interesting to see a similar study carried out in the UK, to explore the impact of regional variations within the discovery of local businesses. It’s certainly a factor that businesses should be considering within their own business intelligence.