
You may have noticed that your Google My Business (GMB) Insights metrics suddenly spiked for searches and views last month. You may have even quietly congratulated yourself on a job well done. After all, it looked as if your discovery and direct searches had risen significantly—coupled with increased views on both Google Maps and standard search.
Well, we’re sorry to have to burst your bubble, but all is not as it seems. From the perspective of a single business, it’s easy to interpret these spikes as a huge win for your marketing efforts. But from our unique vantage point, we have been able to deduce that this unusual development is actually part of a pattern that repeated itself across all of our clients. Here’s how our super sleuths got to the bottom of this head-scratching local search mystery.
A pattern emerges
It was a normal day. We were preparing for client reporting calls, comparing search results year-over-year and paying particular attention to performance over the previous three months. With a fresh pot of coffee brewing, we generated graphics to illustrate our findings:
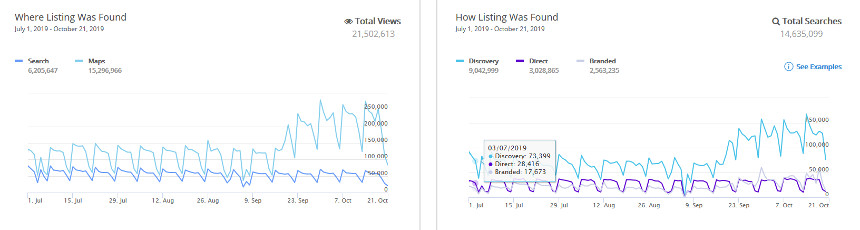
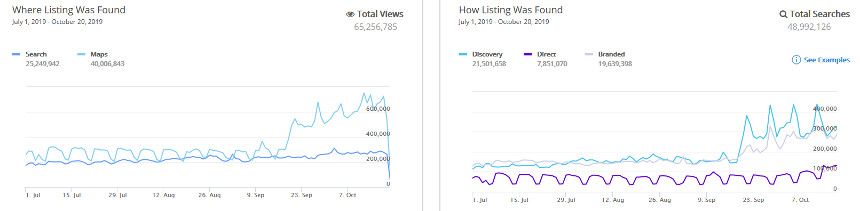
If we were looking at a single location or client, this data could easily be mistaken as a significant marketing breakthrough. But we noticed that this spike repeated itself for almost all of our clients—across many unrelated industries—and started to suspect that whatever we were seeing was actually affecting all local search.
Our first instinct was to correlate our findings against customer actions, including phone calls, website visits, and direction requests. Why? Because these actions are less likely to be reported in error as they require a user performing a specific task. After comparing customer action data for the past quarter for several clients, the answer became clear:
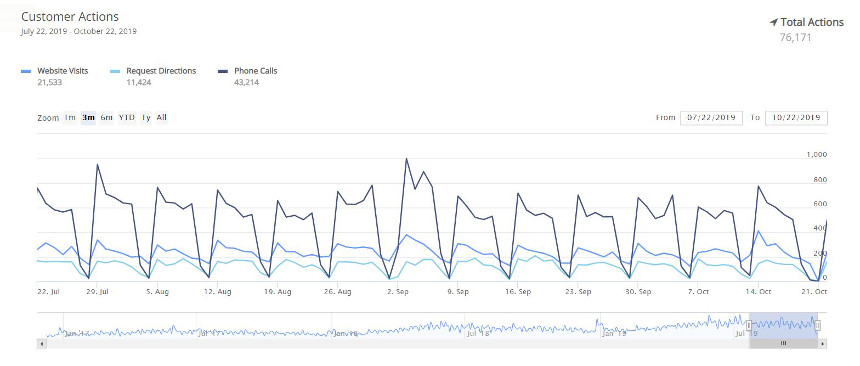
As you can see, unlike views and searches, Google customer actions remain uniform throughout. This would indicate that the September spike was in fact a change in Google’s reporting methodology; perhaps the addition of a source that was previously unaccounted for—one that had no measurable impact on the actual traffic being driven to businesses.
Case closed… or is it?
For those of you invested in your Google search traffic, keep a close eye on your data for the next few months. You may see it rise, fall, or stay at this new inflated baseline. Whatever the case, be careful not to view your data in a bubble. If this search volume change is reverted for some businesses but not others, you could suddenly be comparing apples to oranges. Keep looking at your customer action data and how it correlates to your search volume.
Google is yet to comment on the sudden search traffic spike, but we’re still hoping for a formal announcement about how your GMB data has been affected. Until we know for sure what is happening here, it’s best to defer to GMB Insights rather than hard numbers—or to check in with the dedicated Local Listings Management experts at DAC.